Monitoring & Logs
Track workflow execution status and view detailed logs
Effective monitoring helps you understand workflow behavior, identify issues, and optimize performance. This guide covers the monitoring capabilities available in Agents.
Execution Status
Status Lifecycle
Every workflow execution progresses through these states:
                 ┌→ completed
queued → running ┼→ failed
                 └→ canceled
Status Definitions
| Status | Description | Next States |
|---|---|---|
queued | Execution created, waiting to start | running |
running | Actively processing nodes | completed, failed, canceled |
completed | All nodes finished successfully | (terminal) |
failed | Execution stopped due to error | (terminal) |
canceled | Execution manually or automatically stopped | (terminal) |
Status Timestamps
Each execution tracks key timestamps:
| Timestamp | Description |
|---|---|
enqueuedAt | When execution was created |
seededAt | When initial graph was built |
startedAt | When first node began executing |
completedAt | When execution succeeded |
failedAt | When execution failed |
canceledAt | When execution was canceled |
finishedAt | When execution reached terminal state |
Viewing Executions
Execution List
View all executions with filtering:
Available Filters:
- Status (queued, running, completed, failed, canceled)
- Workflow
- Date range
- Trigger type
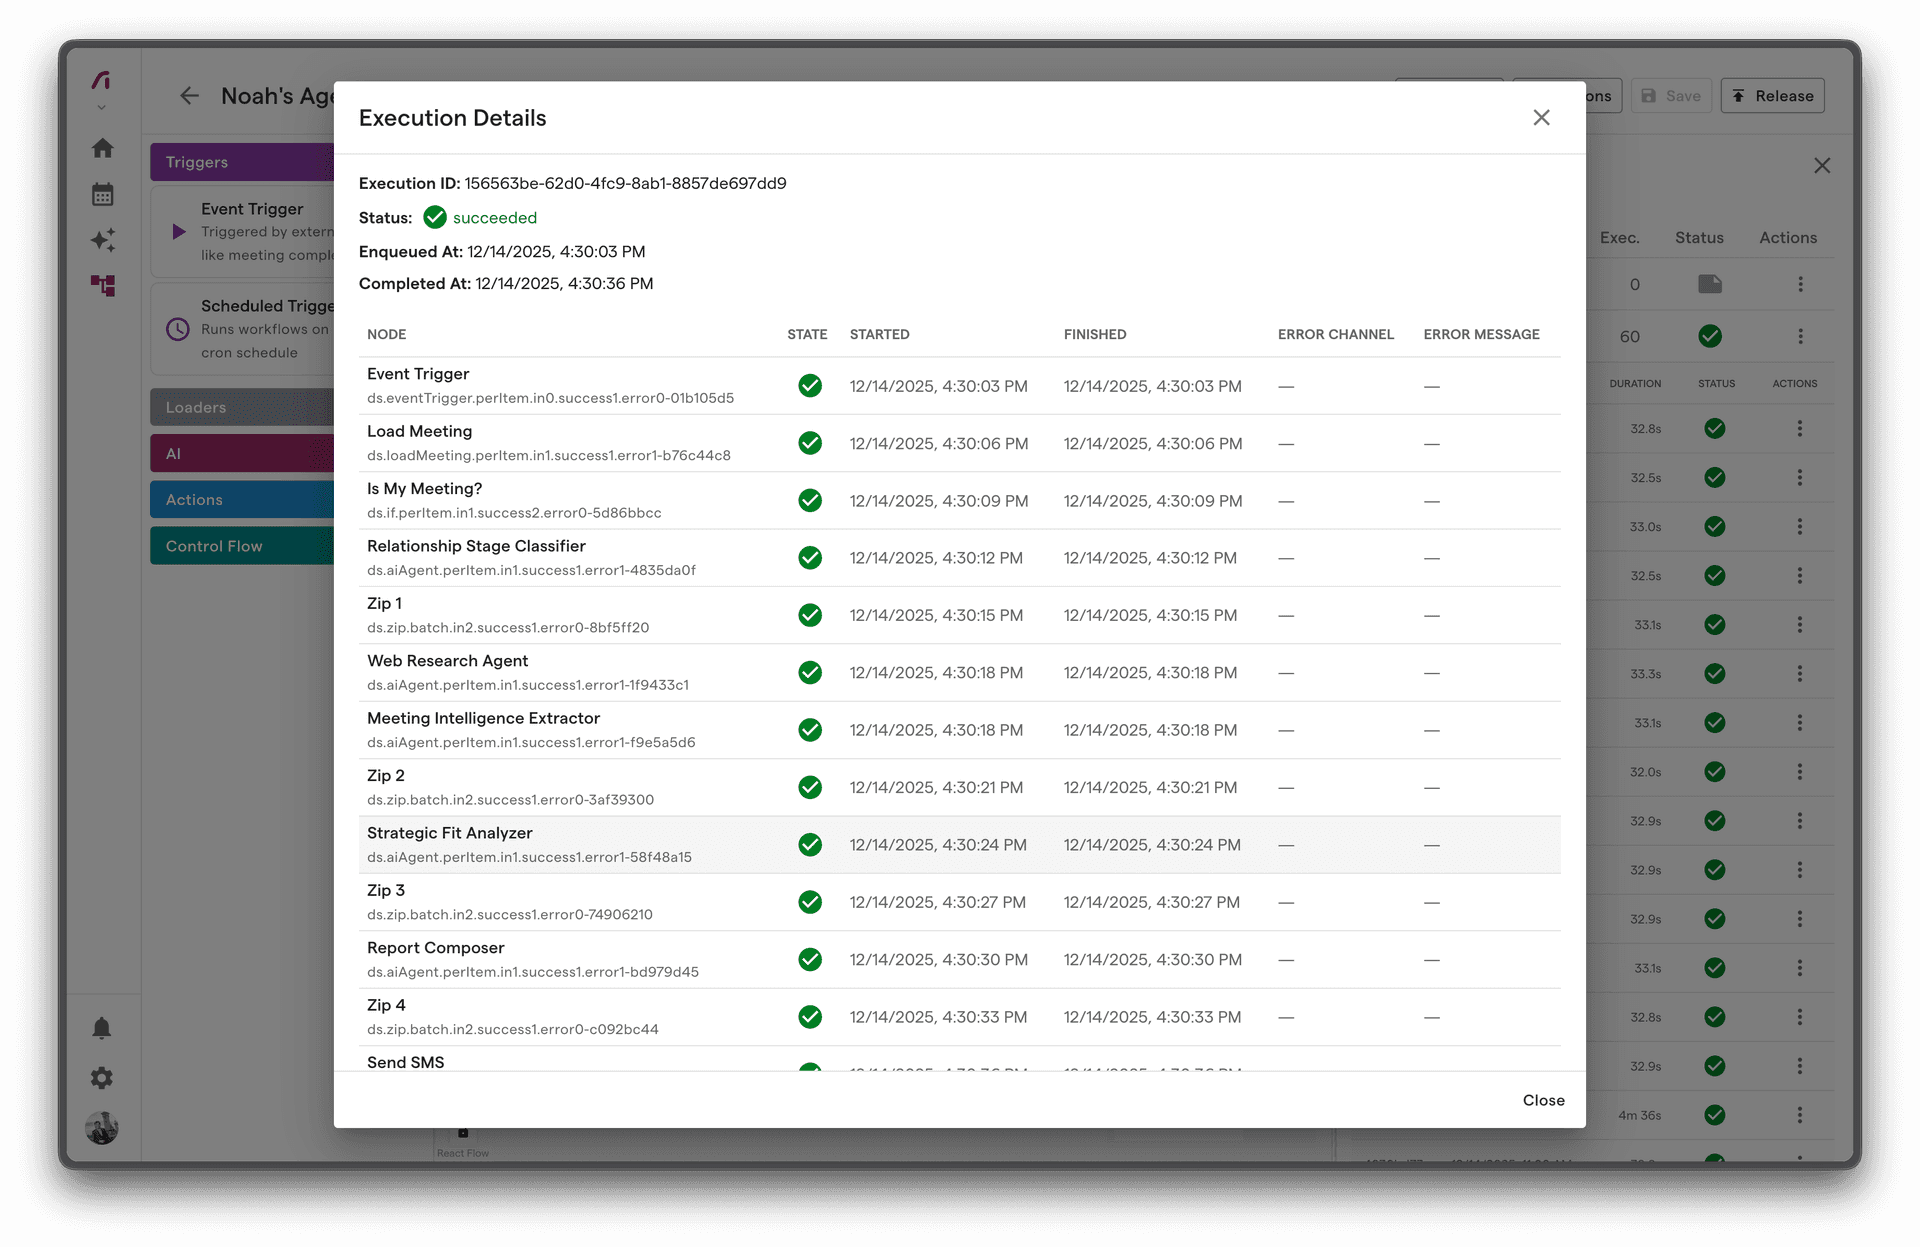
Execution Detail
Each execution shows:
- Summary - Status, duration, trigger info
- Timeline - Visual execution flow
- Node States - Status of each node
- Inputs/Outputs - Data at each step
- Errors - Any error details
Node-Level Monitoring
Node States
Each node in an execution has its own state:
| State | Meaning |
|---|---|
| Pending | Waiting for input |
| Ready | Input available, waiting to execute |
| Running | Currently executing |
| Completed | Finished successfully |
| Failed | Execution failed |
| Skipped | Branch not taken |
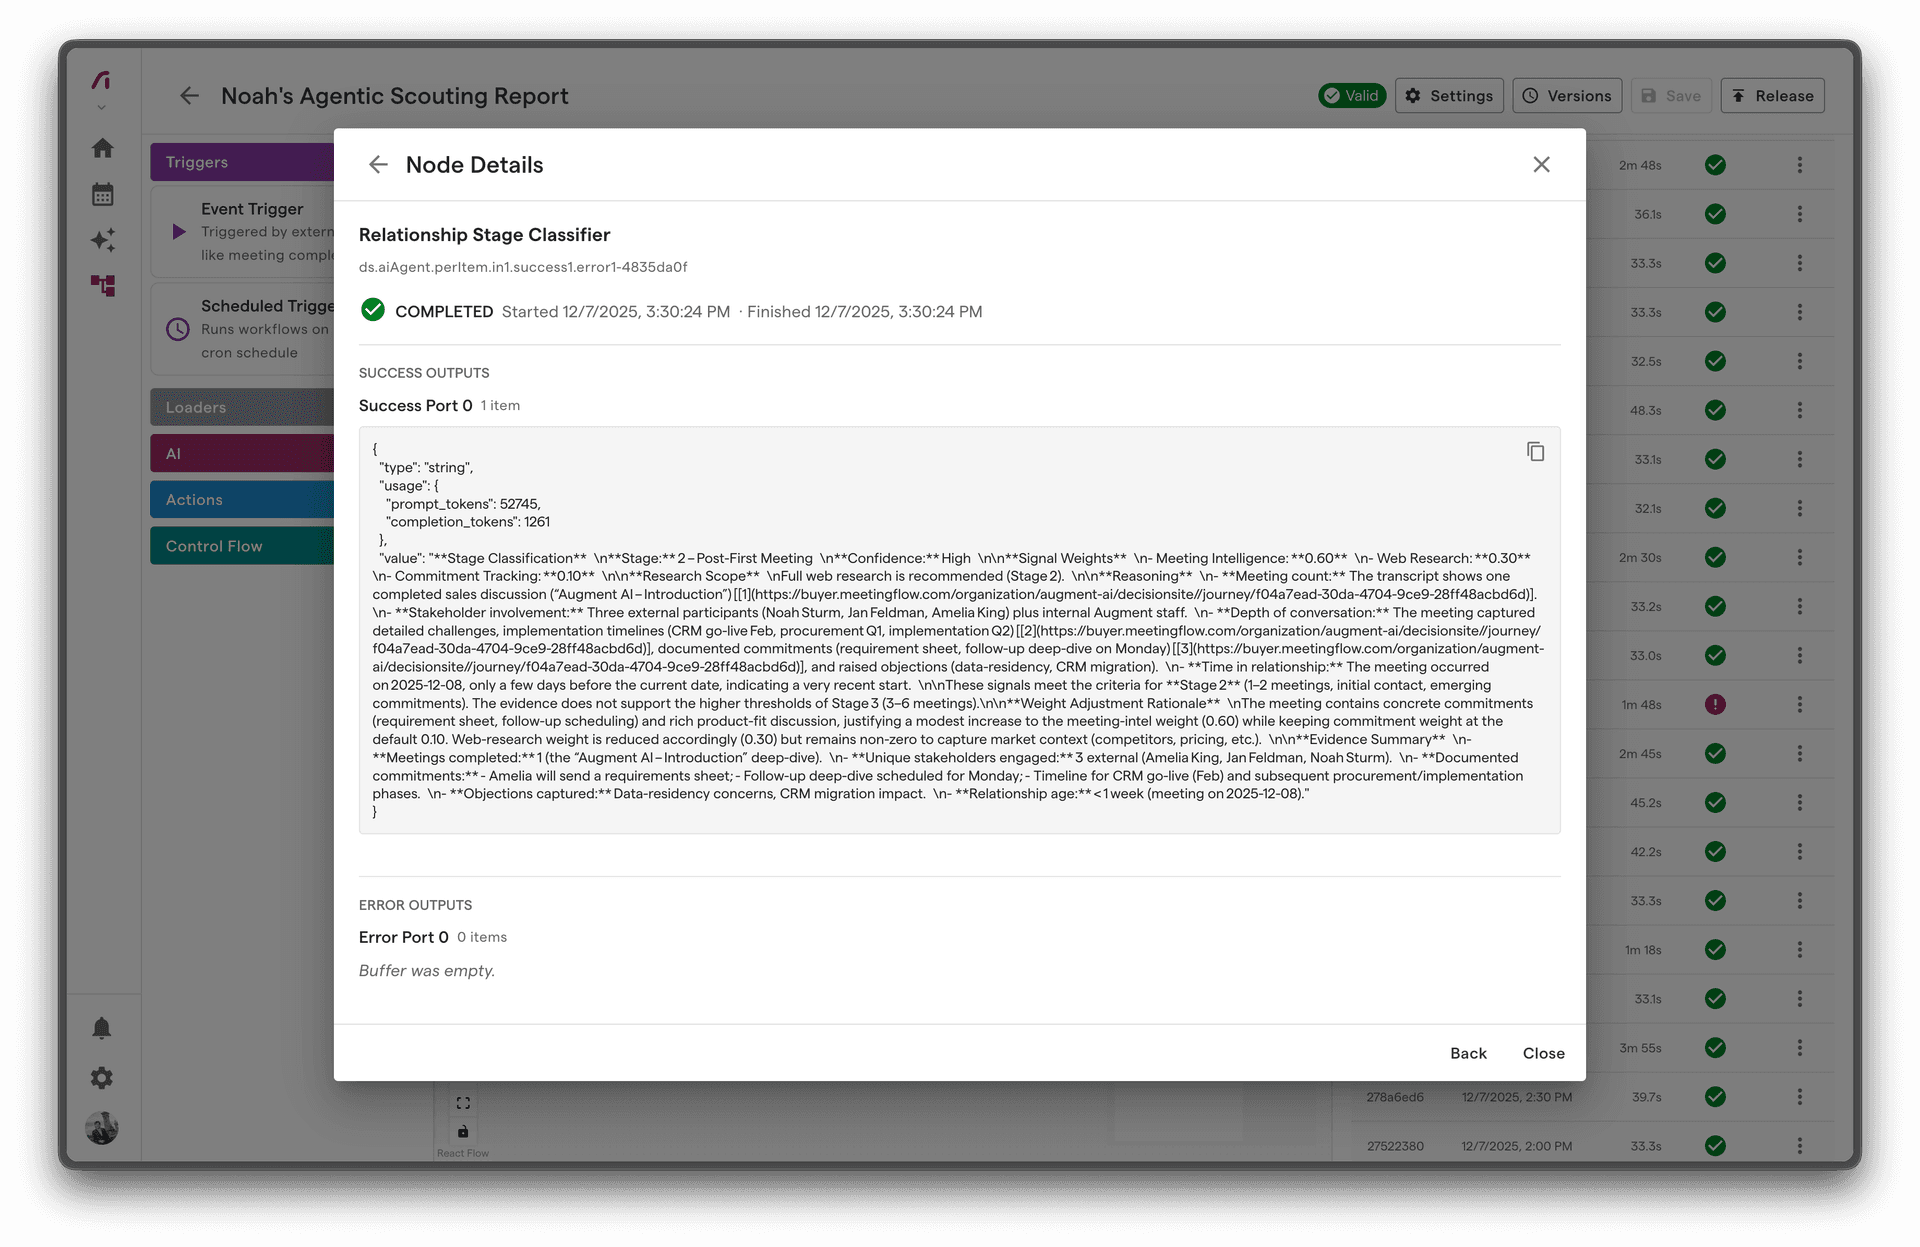
Node Execution Details
For each node, view:
- Input Data - What data the node received
- Output Data - What data the node produced
- Duration - How long execution took
- Attempts - Retry count if applicable
- Error - Error message if failed
Port State Tracking
For complex nodes with multiple ports:
Input Ports:
├── in[0]: 3 items ready
└── in[1]: 2 items ready

Output Ports:
├── success[0]: 5 items produced
└── error[0]: 0 items
Execution Logs
Log Levels
| Level | Purpose | Example |
|---|---|---|
| Info | Normal operations | "Node execution completed" |
| Warning | Potential issues | "Retry attempt 2 of 3" |
| Error | Failures | "API call failed: 429 Rate Limited" |
Log Structure
Each log entry includes:
{
  "timestamp": "2024-01-15T10:30:45.123Z",
  "level": "info",
  "message": "Node execution completed",
  "context": {
    "executionId": "exec-123",
    "nodeId": "node-456",
    "duration": 1250
  }
}
Viewing Logs
Access logs through:
- Execution Detail - Logs for specific execution
- Workflow Logs - All logs for a workflow
- System Logs - Platform-wide logs
Monitoring Patterns
1. Execution Success Rate
Track workflow reliability:
Success Rate = Completed / (Completed + Failed) × 100
Healthy: > 95% Warning: 90-95% Critical: < 90%
2. Execution Duration
Monitor performance over time:
| Workflow Type | Typical Duration |
|---|---|
| Simple (3-5 nodes) | 5-15 seconds |
| Medium (5-10 nodes) | 15-60 seconds |
| Complex (10+ nodes) | 60-300 seconds |
| With AI | Add 5-30 seconds per AI node |
3. Queue Depth
Track pending executions:
Healthy: < 10 queued Warning: 10-50 queued Critical: > 50 queued (processing backlog)
4. Error Patterns
Identify recurring issues:
- Same error message across executions
- Errors at specific times
- Errors for specific trigger types
Error Tracking
Error Information
When a node fails, capture:
| Field | Description |
|---|---|
| Error Type | Classification of error |
| Error Message | Human-readable description |
| Error Code | Machine-readable code if available |
| Stack Trace | Technical details (if available) |
| Context | Relevant data at time of error |
Error Categories
| Category | Description | Action |
|---|---|---|
| Integration Error | External service issue | Check integration status |
| Validation Error | Invalid data | Review input data |
| Timeout Error | Operation too slow | Optimize or increase timeout |
| Permission Error | Access denied | Check permissions |
| Internal Error | Platform issue | Contact support |
Error Notifications
Set up alerts for:
- Execution Failures - Immediate notification
- Error Rate Threshold - Alert when rate exceeds limit
- DLQ Entries - New messages in dead letter queue
Performance Monitoring
Key Metrics
| Metric | Description | Target |
|---|---|---|
| Latency | Time from trigger to completion | < 60s for simple workflows |
| Throughput | Executions per minute | Varies by plan |
| Error Rate | Failed / Total executions | < 5% |
| Queue Time | Time spent queued | < 5 seconds |
Identifying Bottlenecks
Look for:
- Slow Nodes - Nodes taking longer than expected
- High Retry Counts - Nodes requiring multiple attempts
- Queue Buildup - Executions waiting to start
Optimization Opportunities
Based on monitoring data:
| Observation | Possible Optimization |
|---|---|
| Slow AI nodes | Use lower model tier |
| High retry rate | Add error handling |
| Long queue times | Simplify workflow |
| Timeout errors | Optimize node logic |
Dashboard Views
Workflow Dashboard
Overview of all workflow activity:
- Total executions (24h, 7d, 30d)
- Success/failure breakdown
- Average duration
- Recent executions
Execution Timeline
Visual representation of execution flow:
[Trigger] → [Load] → [AI] → [Send]
   0s        1.2s    4.5s    5.1s
Error Summary
Aggregated error information:
- Error counts by type
- Most common errors
- Error trends over time
Best Practices
1. Monitor Proactively
Don't wait for user reports:
- Check dashboards regularly
- Set up automated alerts
- Review DLQ daily
2. Track Baselines
Know what "normal" looks like:
- Typical execution duration
- Expected success rate
- Normal queue depth
3. Investigate Anomalies
When metrics deviate:
- Check for system issues
- Review recent changes
- Examine error patterns
4. Document Incidents
Keep records of:
- What happened
- Root cause
- Resolution
- Prevention steps
5. Use Log Filters Effectively
Filter logs to find issues quickly:
- Filter by execution ID for specific issues
- Filter by error level for all errors
- Filter by time range for incidents
Troubleshooting with Monitoring
Execution Not Starting
Check:
- Is workflow released and active?
- Is trigger configured correctly?
- Any queued executions?
Execution Stuck in Running
Check:
- Which node is executing?
- Has it exceeded timeout?
- External service issues?
High Failure Rate
Check:
- Common error message?
- Specific node failing?
- Integration issues?
Slow Executions
Check:
- Which nodes are slow?
- AI model tier?
- External API latency?